ProgrammingChallenge
This is to help us understand your programming style and expertise. Getting Started :
For this round, you have to write a simple API server, which fetches data from Github and serializes it in a certain format, and visualizes it in form of charts.
It involves a few steps:
- Creating a simple back-end API for which you need to make a REST API call to Github’s API service and fetch the data
- Creating a small front-end application on Django/FastAPI
Challenge Duration - 3 days
Backend API
You will need to write a simple API that returns the top 10 repositories of an organization in Github by stars.
API Details
We will send a POST request to your API at /repos with JSON payload containing Github organization name
For deepvue-tech, this will look like this:
{
  "org": "deepvue-tech"
}
and the API should return a response in the following format (JSON):
{
  "results": [
    { "name": "rick", "stars": 100 },
    { "name": "morty", "stars": 98 },
    { "name": "jerry", "stars": 2 }
  ]
}
Metrics
Response Time: Share your findings on response time and the code that you use for the same.
Front-End App
You will need to create a simple Django/FastAPI app with a single view /dashboard having two charts:
- A Bar Chart showing the results of your API i.e Input an organization, plot the top 10 repos and their star counts coming from your end-point.
- A Line chart showing commits timelines i.e. Input an organization & a repository and select a time range from the time range filter, plot daily total commit during a time range.
Extras
- It is okay to Google or Bing (if that’s your thing)
- Think through the edge cases, especially for organizations with a large number of repos
- Write good, useful docstrings and comments
Bonus
- Add interactivity in graphs/charts to analyze the data coming from APIs
- Deploy this as a microservice on a cloud and share the link Submission
- Once you are done, email us the solution and findings/notes/logs in a zip file titled
-fullstack-intern-hiring-challenge.zip
Solution
Front-end
Dashboard

After Clicking One of the button, Corresponding form shows up for input

After Clicking on Display Button - Form data is sent to JS where request is made and sent to Api Endpoint, Meanwhile Loading screen Comes up !

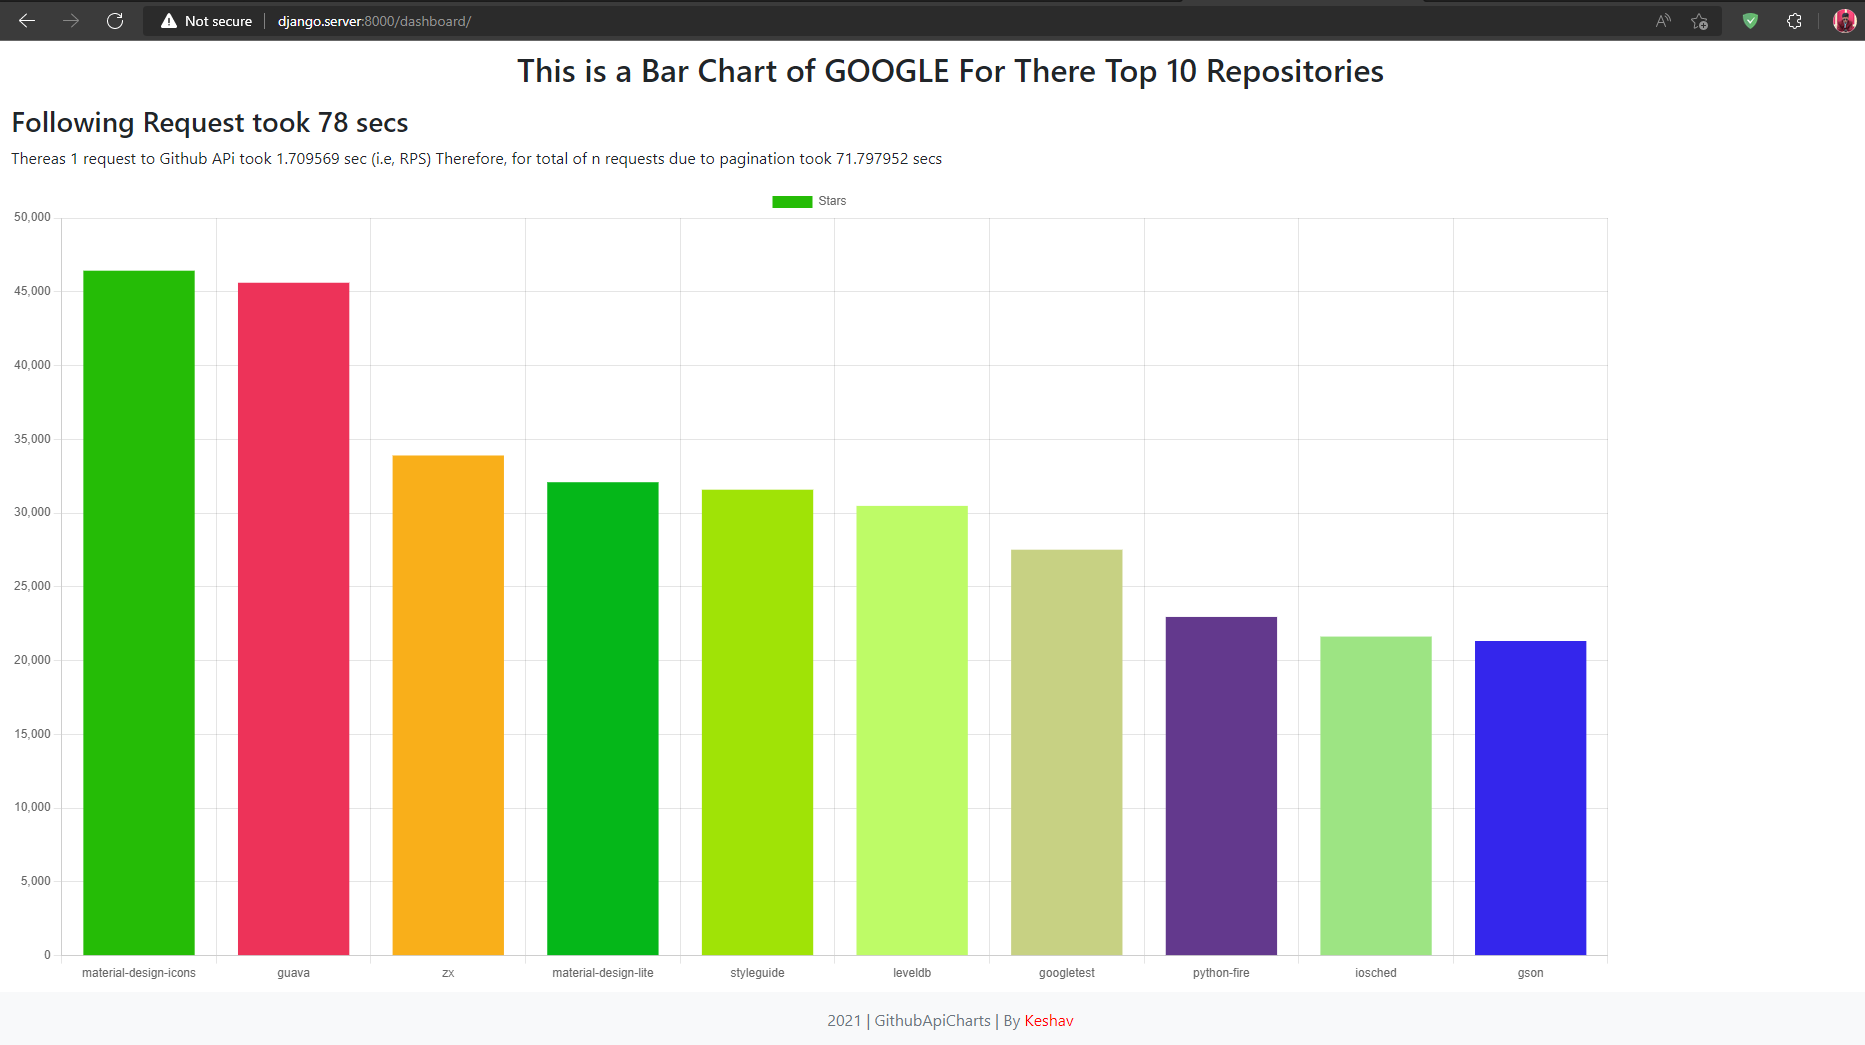
After Recieving Response from API endpoint, Data is send to Charts (using chartsjs lib), And then Chart is displayed into a <_canvas_> 
Same Goes for Line Chart

As view was selected to daily, Therefore, x-axis conatins Dates i.e, 2022-09-03 ! (for Monthly It would be months i.e, 2022-09 and for yearly It would be 2022)

Backend
REST API /repos
Getting Organization name and Number of Top Repositories to Display

Getting Time Takken by One Request (ttbor), Calculating Number of pages (n) (due to pagination) to reach & Looping over pages to store values in result.

Sorting Result according to number of Starts & Adding a Final list to send a response

Adding result, time takken by 1 request by github, Time takken by all requests Github, Time takken to send my response (after sorting etc)

REST API /«org»/«repo»/commits
Getting Values of since, until & view from payload, Where Getting value of org & repo from path parameter itself.

Adding Header, Constructing url, Getting Time takken by one & all responses respectively(ttbor, ttbar) & Calculating Number of pages (n) (due to pagination) to reach & Looping over pages to store values in result.

Looping over pages by creating new request until last page is reached & storing data of every request to result

Adding Result to final (response to be send) with response times.

Findings
API’s /repos: Response time Inscreases Exponentially according to the Organization (If organization have alot of repositories). Due to pagination complexity goes to O(n), Whereas it does not Depends on How many Top repositories you need, Because, It will still need to go through all the repositories.
Running locally:
Download docker-compose and Run:
docker-compose up
Note: This Assumes that you have docker installed into your system.
Deployment link:
Verecel Deployment (Limited) : https://github-api-chart.vercel.app/
Note: it is Deployed on Free tire so it’s functionality is very limited (i.e, not request more than 10sec of reposonse time with will returned, it will throw an error of 404)